CAMEL⁺
Simplifying engineering designs for modern building professionals

Accurate building calculations you can count on each time
Modern buildings are constantly evolving, making it harder to design building services. With so many nuances and components, analysing the big picture is really complex. CAMEL+ calculates the design heating and cooling loads, and associated psychrometrics for air conditioning plant in buildings.
The program is an extremely comprehensive analysis tool that is utilised by thousands of users throughout Australia, New Zealand, and Southeast Asia.
Have confidence, be efficient, and effortlessly collaborate with CAMEL+
 is here
Early-bird pricing ends in:
Accessible anywhere, ACADS-BSG’s latest software solution CAMEL+ is now in the Cloud. CAMEL+ is one of the leading air conditioning load estimation programs available. The calculations are based on the AIRAH Design Application Manual DA09 Air Conditioning Load Estimation. This incorporates the cooling load estimation techniques and data originally developed by the Carrier International Corporation, extended upon and refined by AIRAH.
CAMEL+models a range of system types including:
- Constant volume or variable air volume heating and cooling systems, with or without zone reheat
- Reverse cycle heat pumps and VRF systems
- Direct and indirect evaporative coolers
- Air to air heat exchangers and humidity control systems
Each AHU can serve a number of zones which can in turn have a number of rooms.
A Summary Screen enables reviewing the input and copying moving and deleting AHUs, zones, and rooms.

Graphical displays are provided for schedules, shading schemes and for each external wall or roof as it is entered providing a convenient visual check for the user.
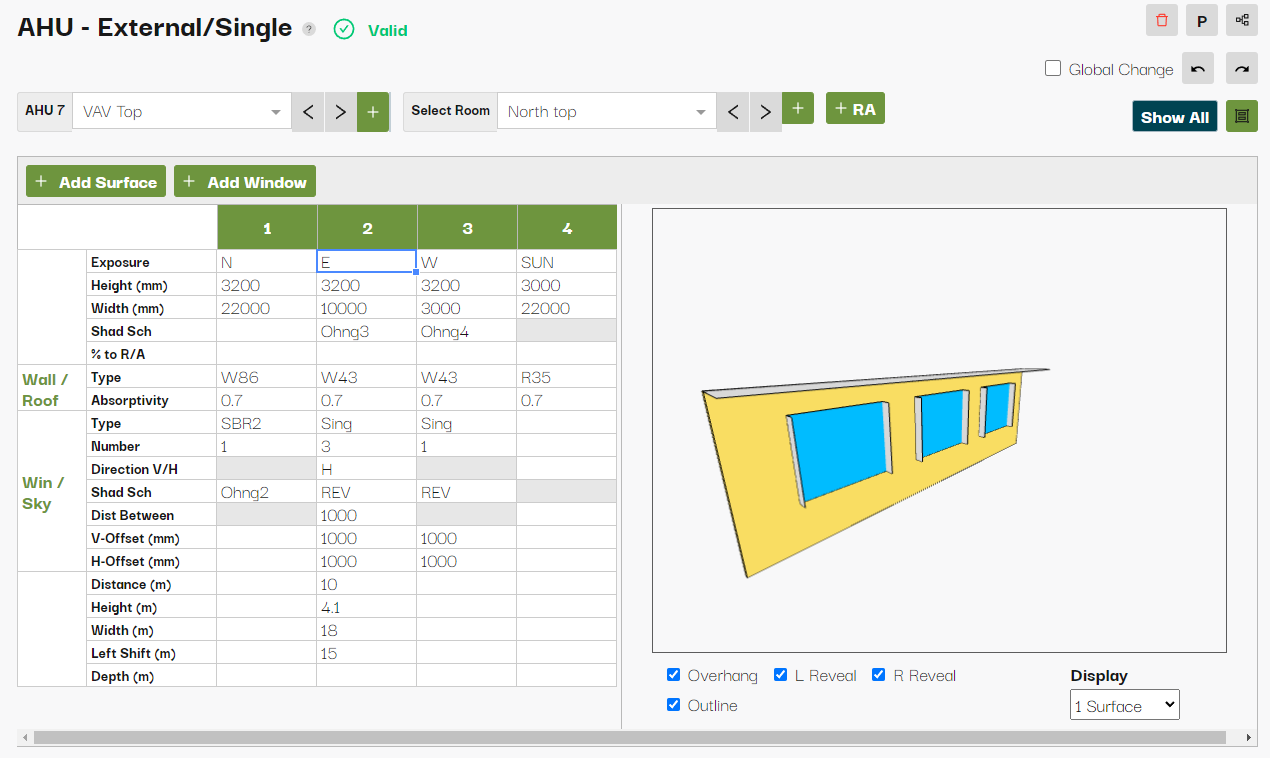
The External Surfaces Screen
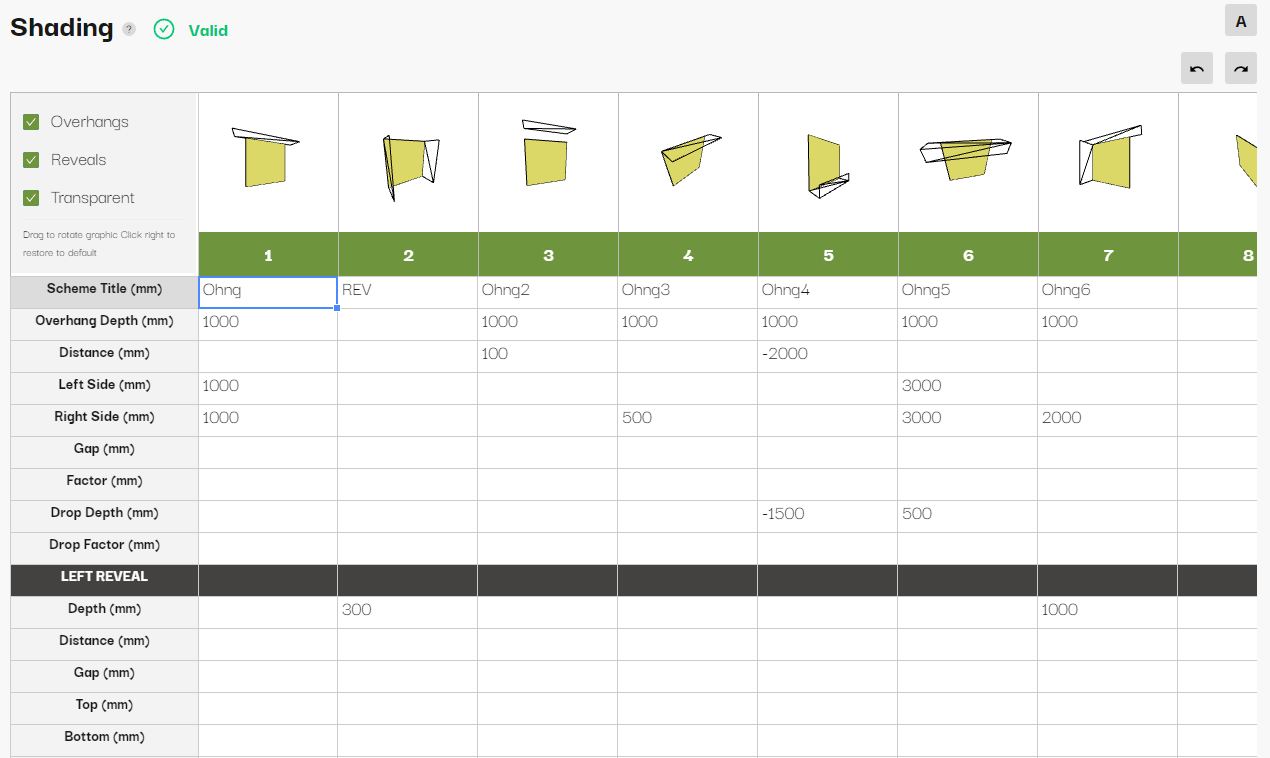
Overhangs, Reveals and Other Shading on Walls and Windows
CAMEL+ caters for overhangs complete with drop panels and reveals on both windows and walls. Shading on roofs and from adjacent buildings can also be modelled.
Drop panels, balconies, light wells and all manner of shading schemes can be modelled by the program.
Overhangs and drops can be opaque or partially or completely transparent.
The shadow patterns of these shading devices can be viewed as they traverse any selected wall or roof as the time and month varies.
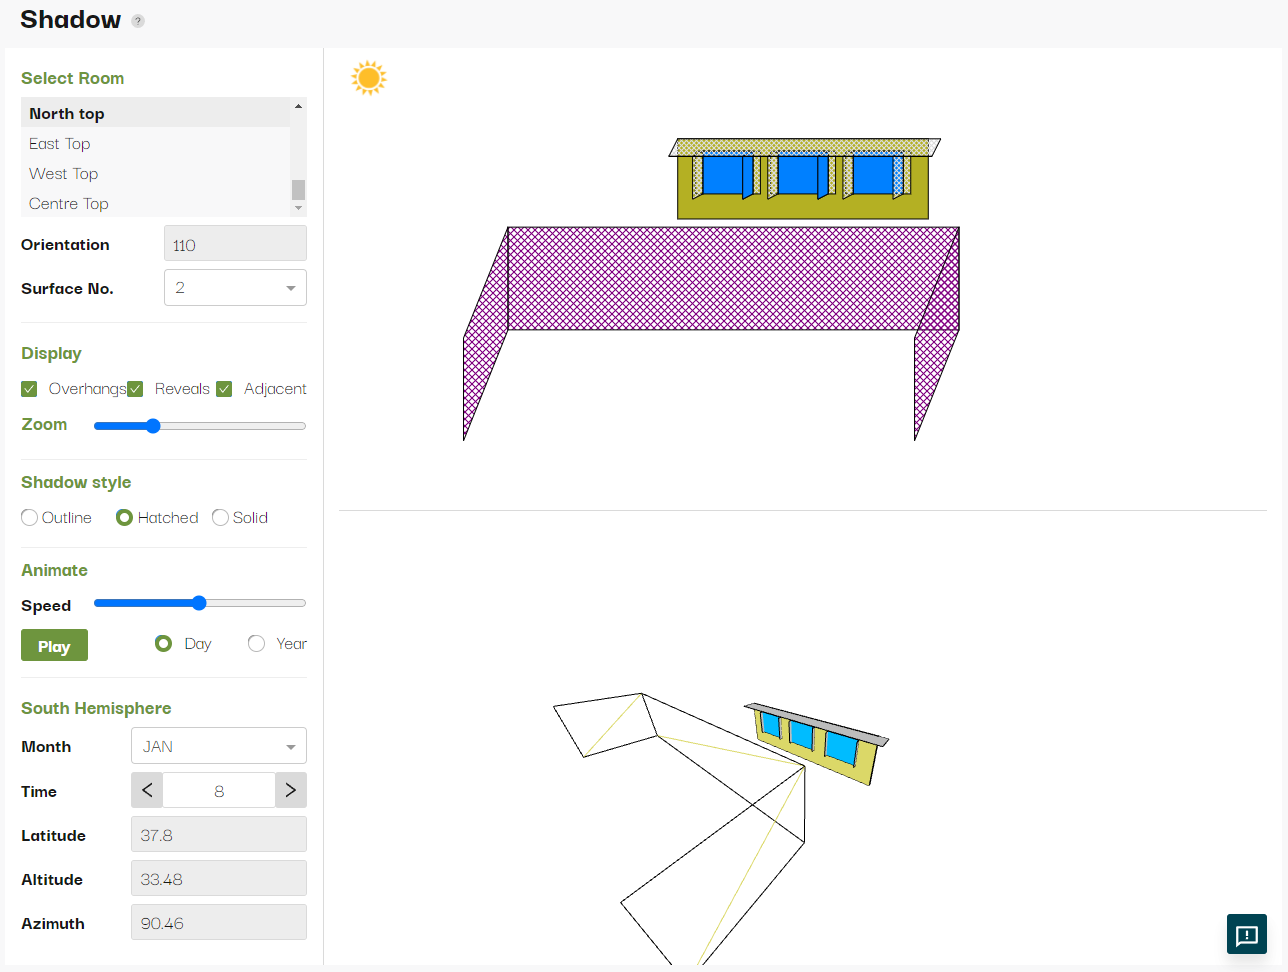
Shadows from an Overhang, Reveals and an Adjacent Building.
A very comprehensive set of results including summary tables of loads and air quantities, load charts, tables of check figures, etc. is provided and these can be selected using a series of check boxes, pull down lists and/or user-defined templates.
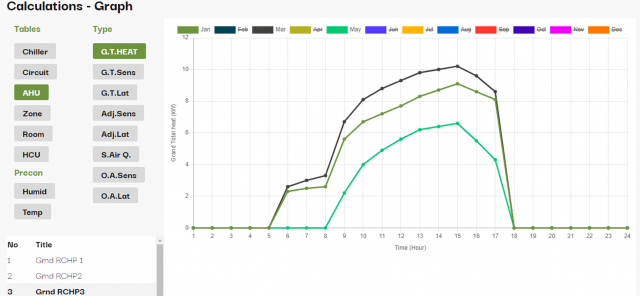
Graphing the Results – Grand Total Heat for Selected Months
The results can also be displayed graphically and a psychrometrics chart is provided for each AHU.
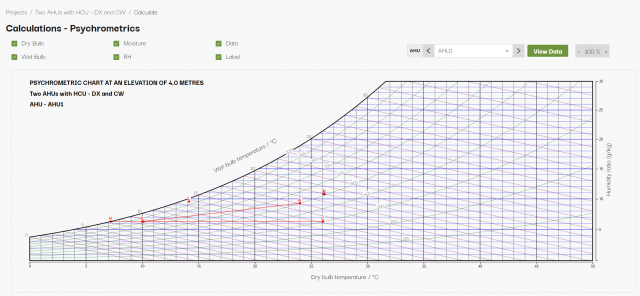
AHU Psychrometric Chart
Other Features of CAMEL+
- CAMEL+calculates chiller, AHU, zone and room cooling loads and air quantities, boiler, zone and room heating loads, and reheat quantities with and without coil reset and room temperatures.
- Comprehensive help is available on every screen and for each item of input.
- Buttons on the toolbars and special keys allow the user to copy individual values, columns of data or complete screens from zone to zone, speeding up the data entry process. There is a facility for making global changes for many items, making re-runs quick and easy; e.g wall types, room conditions, absorption coefficients, etc., can be changed across all AHUs.
- CAMEL+ performs an hourly cooling load analysis, taking into account thermal storage on a design day in each month of the year. It also determines the heating load for each AHU.
- Specific monthly 3 pm design dry and wet bulb temperatures are available in the program for over 600 locations in Australia and for many other locations.
- CAMEL+ carries out a psychrometric analysis for each AHU with the coil performance expressed as a bypass factor, leaving coil temperature or nominated air quantity including fixed air coil bypass systems.
- Fresh air quantities can be entered at room or zone level as l/s/person with the “plant” fresh air quantity then determined using the Multiple Compartment Formula from AS1668.2-2012 for multiple rooms/zones.
- Additional data for light weight roofs (down to 10 kg/m²) has been incorporated. This allows CAMEL+ to analyse buildings with light weight metal deck or similar roofing.
- Precalculated U values and surface densities for a wide range of “standard” wall and roof constructions are available in the program.
- Walls orientations can be at any azimuth and the entire building can be readily rotated.
- The results viewing and printing screen provides for selection of various tables, load charts, summaries, etc, in either viewing or printing mode. The selected output can then be passed to a print file for review before final printing. Templates enable print selections to be retained between runs.
Switching to the Cloud - An Easy Guide PDF
Lorem ipsum dolor sit amet, consectetur
Engineering Simplicity
Stop getting bogged down in complex calculations. Design the appropriate building services with ease.
With over 6000 customers using ACADS-BSG tools every day, our software is making life easier, project by project, and our communities are being transformed with new and more complex buildings all the time. With the right tools, calculating, designing, sizing, and refining building services systems that deliver performance and efficiency has never been easier.


